Configuring Access Rights
You can configure user access rights and assign assets to users. Assets here refer to the environments in Metadata Manager, projects in Mapping Manager, and catalogs in Business Glossary Manager.
To configure access rights, follow these steps:
- On the Users tab, click a user.
- Click the Access Rights tab.
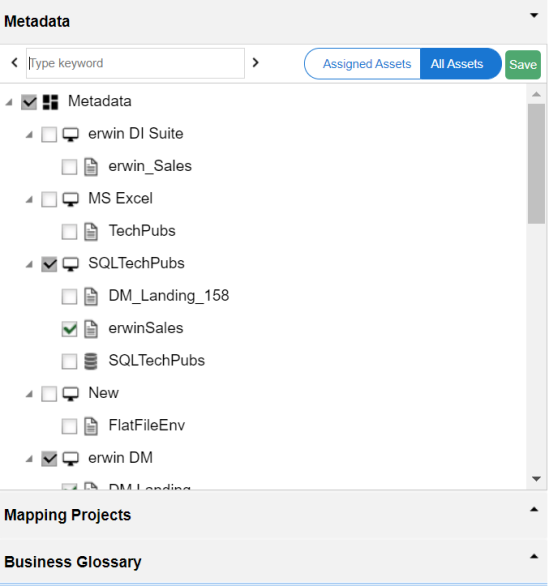
- Click the required pane and switch
 to All Assets.
 - Select the required assets.
- Click Save.
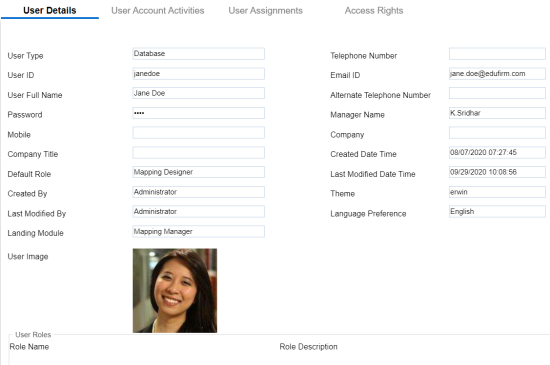
By default, the User Details tab opens.
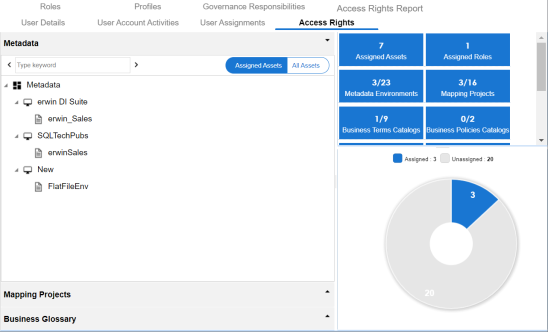
By default, the Metadata pane appears. It displays the environment assigned to the role.
For example, if you switch to All Assets in the Metadata pane, all the environments appear.
The selected assets are assigned to the user.
After, assigning assets to roles, you can view a summary of user assignments with the help of infographics.
Viewing Infographics
The Access Rights tab displays metrics that help you analyze and track user assignments. It presents this information using statistical boards, charts, or graphs.
Statistical Boards
The following statistical boards display metrics about user assignments:
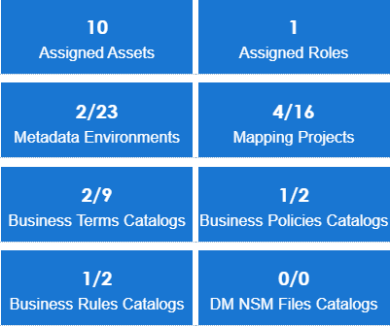
- Assigned Assets: It displays the total number of assigned assets. This includes all the environments, projects, and catalogs assigned to the user.
- Assigned Roles: It displays the number of roles assigned to the user.
- Metadata Environments: It displays the number of environments in the Metadata Manager assigned to the user.
- Mapping Projects: It displays the number of projects in the Mapping Manager assigned to the user.
- Business Terms Catalogs: It displays the number of business terms catalogs in the Business Glossary Manager assigned to the user.
- Business Policies Catalogs: It displays the number of business policies catalogs in the Business Glossary Manager assigned to the user.
- Business Rules Catalogs: It displays the number of business rules catalogs in the Business Glossary Manager assigned to the user.
Metadata
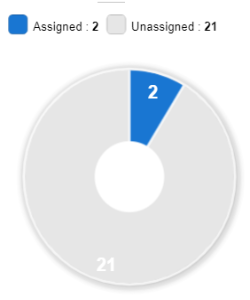
In the Metadata pane, the pie-chart displays the number of assigned and unassigned environments to the user. The blue colored slice corresponds to the assigned environments.
For example, the following pie-chart displays two assigned environments and twenty-one unassigned environments.
Mapping Projects
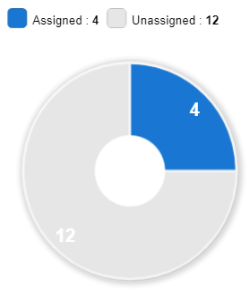
In the Mapping Projects pane, the pie-chart displays the number of assigned and unassigned projects to the user.
The blue colored slice corresponds to the assigned projects.
For example, the following chart displays four assigned projects and twelve unassigned projects.
Business Glossary
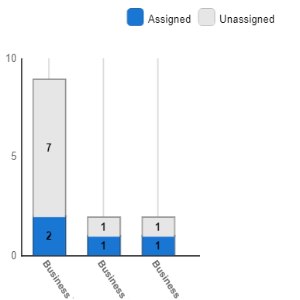
In the Business Glossary pane, the bar graph displays the number of assigned and unassigned catalogs of each type.
The blue colored segment of the bar corresponds to assigned catalogs.
For example, the following bar graph displays two assigned business terms catalogs and seven unassigned business terms catalogs.
|
Copyright © 2023 Quest Software Inc. |